
Oct 27 2026
/
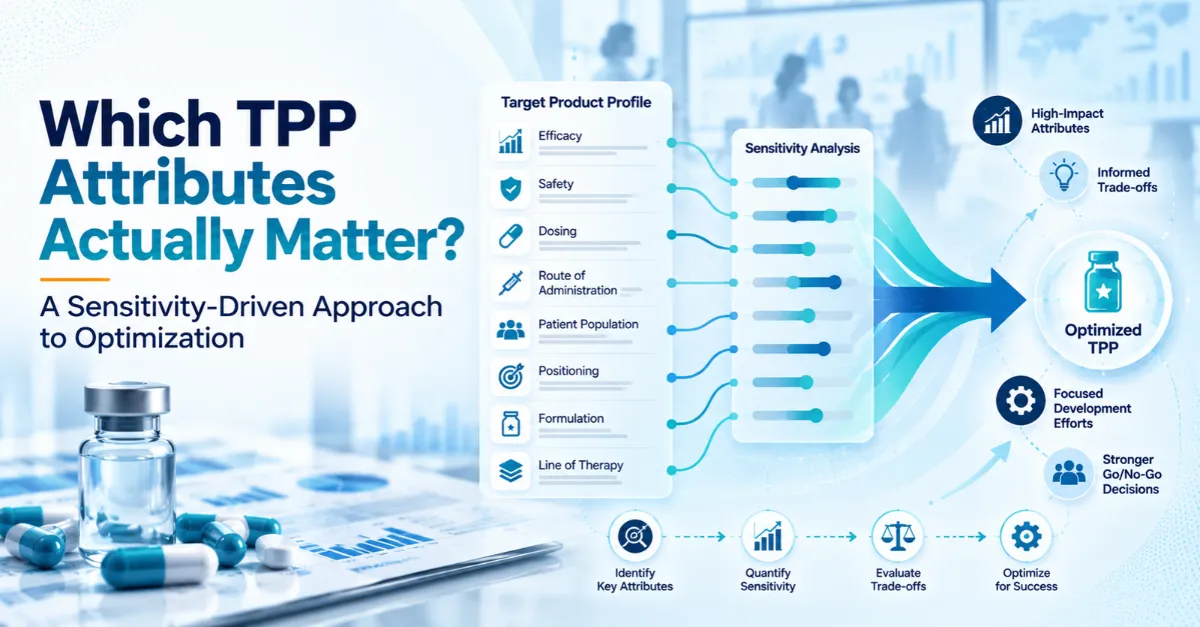
Which TPP Attributes Actually Matter? A Sensitivity-Driven Approach to Optimization
A Target Product Profile usually arrives as a table: indication, line of therapy, efficacy target, safety expectations, dosing, route of administration, positioning. Every row looks equally reasonable.
That is where the trouble starts. Attributes don’t carry equal weight. A small shift in one can reshape uptake, while a large shift in another barely registers. A TPP that treats them alike gives the development team no hint about where to put its effort, money and scientific risk.
Optimization closes that gap. It identifies which attributes decide the outcome, how much room exists to trade one for another, and where the profile is most likely to break. This article walks through a practical, quantitative way to do it: treat the TPP as a set of testable assumptions, measure how sensitive the outcome is to each, and let the results steer development decisions.
Why Equal Rows Hide the Real Drivers
Exubera, the first inhaled insulin, shows how this plays out. Its pitch was convenient: no injections. Pfizer withdrew it in 2007 after sales of about $12 million in the first nine months of that year, against projections of $2 billion a year. Pfizer’s announcement cited a lack of acceptance by patients, physicians, and payers, and the exit carried $2.8 billion in pre-tax charges. Press and analyst accounts at the time pointed to a bulky device, lung-function testing before and during use, and restricted reimbursement. For the people actually deciding, those burdens outweighed the convenience the plan was built on.
A flat profile makes that kind of miss easy, because nothing in it shows which rows carry the weight. Three problems tend to follow:
- Effort gets spread evenly: A team can spend months refining a dosing regimen that prescribers see as a minor convenience, while an assumption about the comparator, which may decide whether the asset is competitive at all, goes unchallenged.
- Trade-offs surface late: If improving one attribute costs another, the team needs to know early. Finding out in Phase 3 that a more convenient formulation weakens exposure, or that a bolder efficacy target needs a safety margin the molecule doesn’t have, is an expensive lesson.
- Go/no-go criteria stay vague: If nobody knows which attributes matter most, nobody can say what result would make the program unattractive. Stage-gate meetings turn into debates.
The way out is to treat the profile as a model: inputs that can be varied, outputs that can be measured.
Step One: Sort Attributes by Impact and Uncertainty
Before any research, rate each attribute on two questions. How much could it move the outcome? How unsure are we about it?
- High impact, high uncertainty: this is where research money belongs. Being wrong is costly and the answer isn’t known yet. Typical examples are the size of benefit needed to displace an entrenched therapy, or whether a given safety finding would restrict the label.
- High impact, low uncertainty: this calls for monitoring. The team broadly knows the answer, though a shift in the landscape could change it.
- Low impact: these can usually be set sensibly and left alone, however uncertain they are. They are tempting to study because they’re easy to ask about, but the tidy findings rarely change a decision.
Doing this honestly is harder than it sounds. Teams tend to rate what they’ve worked on as high impact and what they inherited as settled. A short workshop with clinical, commercial, regulatory and market access colleagues, plus someone from outside the program, gives a more realistic map than one team working alone.
The output is a short list of perhaps five to eight attributes. That list becomes the focus of the work.
Step Two: Establish the Real Baseline
Every attribute is judged against something: current standard of care, an expected comparator, a late-stage competitor. If the baseline is wrong, everything built on it is off.
Most baselines come from published data such as pivotal trials, labels, guidelines and congress presentations. That describes the present well. But a development asset reaches the market years from now, and its real comparison is the landscape at launch. A useful baseline has three parts:
- Current standard of care as practiced: What clinicians prescribe can differ from what guidelines recommend, especially in fast-moving areas or where access varies by region.
- The expected landscape at launch: Identify late-stage competitors, estimate each one’s probability of success, and sketch the profile it would have if it succeeds. Weighting by probability matters. Assuming every Phase 3 rival wins is too gloomy, and assuming none do is too comfortable.
- Direction of travel: Is the field moving toward combinations, earlier lines, biomarker selection, one-time treatments? An efficacy target that is competitive today can look ordinary if expectations are rising.
Epidemiology belongs in the baseline too. Eligible population size, the share reaching a given line, biomarker prevalence and diagnosis rates all set how much an attribute can matter. A modest advantage in a large, treatment-naive population can be worth more than a strong one in a narrow, late-line segment. Keep epidemiology and the TPP in separate workstreams and those interactions stay hidden.
Step Three: Measure What Stakeholders Will Give Up
With focus attributes chosen and a baseline set, the question becomes how much of one attribute stakeholders would give up to gain another.
Choice-based research answers it. In a conjoint or discrete choice exercise, respondents see realistic product profiles with different attribute combinations and pick the one they would prescribe. Repeated across many combinations, the choices reveal how strongly each attribute drives selection and where the exchange rates sit.
A few practical points make these studies worth running:
- Use realistic levels: Span the plausible range, including the weak end of what the asset might deliver. If every option on screen looks excellent, the results won’t show where the real thresholds are.
- Include comparators: Show current standard of care and expected competitors as options, so the result reflects competitive preference.
- Segment respondents: Community and academic prescribers, different specialties and different patient mixes often weigh attributes differently. The segment most likely to adopt early may look nothing like the average.
- Add the “why”: Short interviews before and after the quantitative exercise explain the choices and often expose a misread attribute or a hidden assumption.
Payers need a different method, such as structured interviews or scenario exercises, but the aim is the same: find out which combinations of attributes and evidence they would accept.
A good output reads like this: “Prescribers would accept a smaller efficacy advantage in exchange for removing a monitoring requirement, but only above a certain level of benefit.” A sentence like that tells a team where to invest.
Step Four: Connect the Profile to the Forecast
This step turns research into a decision tool. The findings have to flow into a forecast model, so that changing an attribute changes patient share, patient numbers, and revenue.
The structure is simple. Build the forecast bottom-up from epidemiology: prevalent and incident populations, diagnosed and treated segments, lines of therapy. Let the attribute-level preference data drive uptake, with the TPP attributes as inputs. Then run scenarios:
- What happens to peak share if efficacy lands at the low end of the target range?
- What if a safety finding narrows the eligible population?
- What if the label is limited to a later line than planned?
- What if a competitor launches a year early?
- What if payers ask for a head-to-head comparison the trial plan doesn’t include?
Here is a purely hypothetical illustration. Suppose one scenario trims peak share by two points, while a label limited to the second line trims it by eight. The label question deserves the next research dollar.
A tornado chart, which ranks attributes by how far the forecast moves when each is varied, shows this well. The attributes at the top deserve defending. The ones at the bottom are candidates for compromise.
Two cautions apply. First, a weak model gives a precise-looking wrong answer, and forecasting has a poor record here. A study in Nature Reviews Drug Discovery covering 1,700 analyst forecasts for 260 drugs launched between 2002 and 2011 found actual peak sales differing from predictions by 71% a year before launch, and still by 45% six years after. That is why the quality of the epidemiology and preference inputs matters so much. Second, sensitivity analysis shows what the model says, not what will happen. Use it to see which attributes matter relative to each other, and treat any single number with suspicion.
Step Five: Account for Probability and Timing
The TPP describes the best case. Clinical results may deliver something lower, and the analysis should say so.
The development base rates put that uncertainty in perspective. In the BIO, Informa and QLS analysis of 2011 to 2020, the overall likelihood of approval from Phase 1 was 7.9%, and the average path from Phase 1 to approval took 10.5 years. A TPP written at Phase 1 describes something that, historically, rarely makes it through.
The same dataset shows how an attribute can change the odds. Programs that selected patients by biomarker had a likelihood of approval of 15.9%, roughly double the overall rate and well above programs that did not use biomarker selection. A biomarker-selected profile may therefore raise the chance of success while shrinking the eligible population, which is exactly the kind of trade-off the model should price.
For each key attribute, define a range of plausible outcomes and assign rough likelihoods based on mechanism, early data, and precedent from similar programs. Running the forecast across that distribution gives an expected value and, more usefully, a picture of the downside.
Timing deserves the same treatment. A year’s delay can change the competitive picture a great deal, especially in crowded areas. If a faster route means accepting a weaker profile, does the earlier launch pay for it? Without a model linking attributes, timing and forecast, that call rests on instinct.
The same model can set the stage-gate lines. Once you can see how far peak share or revenue falls when efficacy, safety or timing slips, you can define in advance the point at which the asset stops being attractive, and treat crossing it as a formal decision point.
Regional Differences in Attribute Weighting
Attributes don’t weigh the same everywhere. Comparators, reimbursement mechanisms, evidence requirements, treatment patterns, and preferred routes of administration all vary.
In the United States, formulary design and utilization management can shape access in ways clinical data alone won’t predict. In many European markets, HTA bodies set the evidence bar and often favor particular endpoints or comparators. In Japan and China, local practice, regulatory expectations, and pricing mechanisms add further variation.
For multi-market assets, it is worth running the weighting by region. A single global TPP can hide conflicts that only surface during regional launch planning. Sometimes the answer is a core profile with regional variations. Sometimes one region needs a different evidence package from the start.
Special Considerations in Rare Disease
The logic holds in rare and ultra-rare diseases, but the constraints change. Populations are small and natural history data can be thin. The pool of experienced specialists may number a few dozen worldwide, so a conjoint study with hundreds of respondents is rarely possible.
In an ultra-rare neuromuscular condition, for instance, a dozen well-chosen interviews with treating neurologists, combined with caregiver input and careful epidemiology, can tell a team more than a survey that nobody can fill. Optimization leans on that kind of qualitative and expert-led work.
The patient’s perspective carries extra weight. Families care about functional outcomes, daily burden and how practical administration is, which may differ from what regulators or investigators emphasize. An endpoint accepted for approval that means little to patients can limit adoption and advocacy support.
Payers also treat budget impact and unmet need differently for small populations, and evidence packages may rely on external controls, natural history comparisons or surrogate endpoints. Knowing what evidence payers would accept, and when, can influence trial design early. The principle is unchanged: find the attributes carrying the most risk and test those first. Only the methods bend to fit the population.
Common Pitfalls
- Optimizing for the average respondent. Means hide segments. Early adopters and skeptics may want different things, and launch strategy depends on which group the asset has to win first.
- Treating stated willingness as behavior. Respondents are usually more open to novelty in a survey than in daily practice. Calibrate against uptake from comparable launches.
- Defending the model. A forecast is a tool for exploring structure. A team that nudges the uptake curve until the output clears the internal hurdle rate has stopped forecasting and started justifying. Question the assumptions, not the answer.
What a Useful Output Looks Like
A well-run exercise leaves the team with a few clear deliverables:
- A ranked view of attributes by their impact on uptake and forecast
- Acceptable trade-offs, stated in specific terms
- Upside, base and downside scenarios
- Model-derived thresholds that trigger a reassessment
- A list of evidence gaps and the data needed to close them
It is usually a shorter document than the original TPP, and that is the goal: a long profile reduced to the handful of commitments worth defending.
Conclusion
Every TPP is written before the evidence is in, so some of its attributes will turn out to matter far more than others, and some assumptions will carry most of the risk. Sensitivity analysis lets a team find out which ones early, while there is still room to change course.
The route is straightforward: classify the attributes, set a realistic baseline, measure the trade-offs, link the profile to a forecast, and build in probability and timing. The result is a profile the team can defend, and a development plan that spends effort where it counts.
At Thelansis, our TPP analysis and optimization work brings together secondary research, primary insights, epidemiology and forecasting, so the profile and the numbers behind it are built together.