
Oct 08 2026
/
Forecasting Rare Disease Markets: Why Small Patient Populations Demand a More Rigorous Model
Rare disease markets have an odd commercial paradox built into them: the patient population is tiny, but the market opportunity can still be substantial. That’s what makes forecasting them fundamentally different from forecasting a conventional primary care or high-prevalence therapy market. A forecast built mainly on prevalence can look perfectly reasonable on paper and still miss the commercial reality, because in a rare disease, a relatively small shift in diagnosis rates, treatment eligibility, launch timing or patient persistence can move the market by millions of dollars. When the denominator is small, every patient matters more.
This is only becoming more relevant as the pipeline expands. In 2025, 23 of the FDA’s 46 novel drug approvals received orphan drug designation, according to the FDA’s own year-in-review. The agency also received 657 original orphan-drug designation requests in FY2025 and granted 450 of them. The result is a market that’s growing more competitive, more segmented, and harder to forecast with a conventional top-down model.
The Problem With Starting From Prevalence
The traditional forecasting equation is simple enough: patient population × treatment rate × price = market size. In rare diseases, that first variable is usually the least reliable one. Say a disease has an estimated prevalence of 1 in 60,000. Applying that rate to a country’s population gives you a theoretical patient count, but that’s not the addressable market. Some patients are never diagnosed. Some receive a different diagnosis altogether. Others lack genetic confirmation, fall outside the approved age range, or simply don’t meet treatment criteria.
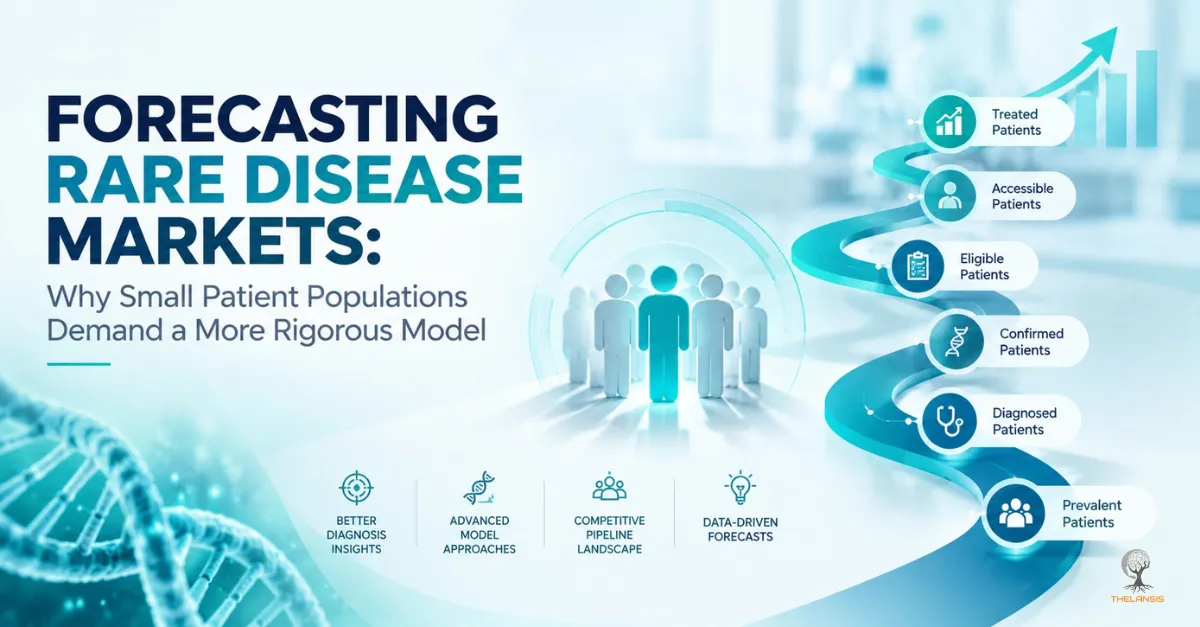
The commercially relevant population looks more like a funnel:
prevalent patients → diagnosed patients → confirmed patients → eligible patients → accessible patients → treated patients → persistent patients
Each step introduces its own source of forecast variation. The FDA itself points to small patient populations, genotypic and phenotypic heterogeneity, and a limited understanding of natural history as core challenges in rare disease development. For forecasting teams, prevalence belongs at the start of the model, as an input to be worked through the funnel, not at the end as the market size itself.
To make this concrete, take a hypothetical monogenic disease with an estimated prevalence of 1 in 60,000. In a country of 60 million people, that’s a theoretical population of 1,000 patients. Run it through the funnel: 70% ever get diagnosed, 80% of those receive genetic confirmation, 60% meet the approved treatment criteria, and 75% of eligible patients gain access and start therapy. The treated population three years post-launch might be closer to 250 patients than 1,000. A forecast that stops at prevalence overstates the near-term market by 4x. That gap is the entire reason patient-flow modeling exists.
Diagnosis Can Grow the Market Without Changing Prevalence
This is one of the most important and most often underestimated dynamics in rare disease forecasting. The number of people who actually have a disease can stay roughly flat while the number of diagnosed patients climbs significantly, simply because genetic testing becomes more accessible, specialist awareness improves, newborn screening catches patients earlier, diagnostic criteria sharpen, or new biomarkers help distinguish one disease from a look-alike. The commercial market can expand even when the underlying epidemiology hasn’t moved at all. That’s the distinction between epidemiological growth and addressable-market growth.
A forecast that assumes a fixed diagnosis rate across the whole forecast period risks underselling a market where diagnostic infrastructure is improving quickly. Assuming every newly identified patient gets treated immediately carries the opposite risk: overstating the near-term opportunity. The real question is how quickly the healthcare system can find the patients who already exist.
Patient advocacy groups are an underused input here. For many rare diseases, they run the only natural history studies and patient registries that exist pre-approval, often the sole source of real-world data on disease progression, diagnostic delay, and treatment patterns before a therapy reaches the market. These groups also drive diagnosis rates directly, through physician education, newborn-screening advocacy, and patient-finding programs, and they’re frequently the fastest channel for trial recruitment in ultra-rare populations. A forecast that treats diagnosis rate as a purely technological or clinical variable, without accounting for what an active advocacy community can do to accelerate case-finding, will typically underestimate how fast the addressable population grows post-launch.
Rare Disease Markets Are Increasingly Pipeline-Driven
There’s also a structural difference in how competition plays out. In a large therapeutic area, a new entrant typically takes share from an established market. In a rare disease, a new therapy can redefine the market itself. A first-in-class treatment might create a treated population where little or no effective therapy existed before, a biomarker-selected therapy can split a broad population into smaller segments, and a new mechanism can pull treatment earlier into the disease course. Because of this, the pipeline needs to be built directly into the forecast rather than treated as a separate competitive section.
Emerging biopharma companies have taken on a steadily larger share of rare disease clinical development over the past decade. Forecasting therefore increasingly requires tracking small biotech companies and platform technologies alongside the established players in a therapeutic area.
One Approval Can Rewrite the Entire Treatment Algorithm
Take a rare disease with one established therapy and two late-stage assets in the pipeline. A conventional forecast might just split market share three ways, but the more important question is whether those new therapies are even competing for the same patients. One might be positioned for newly diagnosed patients, another for those who’ve failed the existing treatment, and a third might push into earlier-line use entirely. If one offers a meaningfully different administration schedule, safety profile, or clinical benefit, physicians may restructure their treatment sequencing rather than simply swap brands. Share forecasting has to be tied to treatment-line dynamics: the operative question is which patients a product is actually competing for, not what flat percentage it might capture.
Launch Timing Matters Disproportionately
In a rare disease, the eligible pool is small and often concentrated in a handful of specialist centers, so early commercial execution has an outsized effect. The first therapy to build relationships with those centers and treat the first patients can lock in share that’s hard to dislodge, which means a launch that lands a few quarters earlier or later can shift the entire adoption curve.
Forecast models need to account for probability of regulatory approval, expected launch timing, the regulatory pathway itself, manufacturing readiness, specialist-center availability, diagnostic requirements, reimbursement timing, initial uptake, and competitor launches together, not as separate line items. The FDA’s 2025 Rare Disease Evidence Principles are a good example of how this development environment keeps evolving, particularly for therapies targeting small populations tied to known genetic defects. The practical lesson: model development and launch uncertainty directly, rather than treating approval as a binary event with a fixed launch date.
Price Alone Doesn’t Define the Opportunity
Rare disease therapies tend to carry high per-patient costs, since development and commercialization expenses have to be recovered from a small population, but a high list price doesn’t automatically translate into high revenue. The more useful calculation is eligible patients × treatment uptake × treatment duration × net realized price. The distinction between chronic and one-time treatment matters a lot here: a chronic therapy generates recurring annual revenue from the same patient, while a one-time gene therapy can produce a much larger initial contribution per patient but on a completely different long-term revenue curve. The forecast has to capture how revenue accrues across the full patient journey, not just how many patients get treated.
Payer Access Is Where Theoretical Market Size Meets Reality
Regulatory approval only creates the possibility of commercialization; it doesn’t guarantee reimbursement. That gap matters even more in rare disease because the clinical evidence is often generated in very small populations. Payers scrutinize long-term durability, comparative effectiveness, quality-of-life outcomes, budget impact, treatment eligibility, genetic confirmation, prior treatment requirements, and evidence of sustained benefit. Payers and policymakers are increasingly subjecting orphan medicines to the same budget scrutiny as any other therapy, rather than treating them as automatic exceptions. Access has to be modeled market by market; “approved patients = treated patients” is a shortcut that rarely survives contact with a payer.
The US, Europe, Japan and China Don’t Share the Same Assumptions
A global forecast can go badly wrong if the same diagnosis, treatment and uptake assumptions get applied across every geography. The US generally has a more developed specialist network and reimbursement infrastructure; Europe has meaningful country-by-country differences in HTA, reimbursement and access; Japan runs its own regulatory and reimbursement environment; and China presents a different mix of patient identification, specialist access, regulatory evolution and reimbursement dynamics altogether. A global forecast is best built bottom-up from country-level assumptions:
population → diagnosed population → confirmed population → eligible population → accessible population → treated population → persistent population → revenue
and then aggregated, so it’s clear exactly where the opportunity is being constrained.
Uncertainty Isn’t a Weakness in the Forecast; It’s the Point
One of the biggest problems with rare disease forecasts is false precision. Reporting a market of $2.4 billion in 2035 implies a level of certainty the underlying evidence simply can’t support. A better model exposes the variables actually driving that uncertainty through scenarios: a base case built on expected diagnosis growth, treatment uptake, competitive entry and reimbursement; an upside case with faster diagnosis, stronger clinical differentiation, broader reimbursement and earlier adoption; and a downside case with delayed diagnosis, restrictive access, slower uptake or heavier competitive pressure. Running these scenarios isn’t about producing three different market-size numbers. It’s about identifying which assumptions actually have the power to change an investment decision. If shifting the diagnosis rate barely moves the forecast but shifting treatment duration moves it substantially, treatment persistence is what deserves the attention.
What Rare Disease Forecasting Needs to Measure Next
The next generation of rare disease forecasts will likely rely less on a single prevalence estimate and more on patient-flow modeling that tracks:
- How many patients are identified
- How many receive a confirmed diagnosis
- How many meet treatment criteria
- How many can actually access the therapy
- How quickly physicians adopt it
- How long patients stay on treatment
- What happens once the next competitor enters
That shift is already visible in the broader landscape. Roughly 95% of the world’s several thousand known rare diseases still have no approved treatment, even as rare disease development represents a significant share of the overall pipeline. Building this kind of model well depends on triangulating claims data, patient registries, natural history studies, and specialist input. No single source tells the whole story in a population this small.
The Commercial Question Has Changed
Rare disease forecasting used to be mostly about proving that a small population could support an economically viable therapy. Today, the market may already be commercially attractive on paper, but the harder question is what its trajectory depends on: diagnosis, treatment eligibility, competitive sequencing, payer access, treatment duration, and how fast new technologies reach patients. A robust forecast explains what has to happen for its headline number to be achievable, and what could get in the way.
This is the discipline our rare disease market reports are built around at Thelansis: mapping the diagnosis-to-treatment funnel country by country and stress-testing it against scenarios, rather than anchoring to a single prevalence-derived number.
In rare diseases, a market of a few thousand patients can be harder to forecast than one of millions; the smaller the population, the less room there is for an assumption to be wrong.