Neutropenia Market Outlook
Thelansis’s “Neutropenia Market Outlook, Epidemiology, Competitive Landscape, and Market Forecast Report – 2021 To 2032″ covers disease overview, epidemiology, drug utilization, prescription share analysis, competitive landscape, clinical practice, regulatory landscape, patient share, market uptake, market forecast, and key market insights under the potential Neutropenia treatment modalities options for eight major markets (USA, Germany, France, Italy, Spain, UK, Japan, and China).
Neutropenia Overview
Neutrophils play a crucial role in the immune system by ingesting, destroying, and digesting invading microorganisms, encompassing fungi and bacteria. Failure to fulfill this role results in immunodeficiency, characterized primarily by recurrent infections. A standard circulating neutrophil count is above 1.5 x 10/L. Neutropenia, defined as an absolute neutrophil count (ANC) below 1500 per microliter (1500/microL), can be categorized as asymptomatic (mild), moderate, or severe, indicating the risk of infection. The severity of neutropenia is stratified as follows:
- Mild: 1000 to 1500/mcL (1 to 1.5 × 10^9/L)
- Moderate: 500 to 1000/mcL (0.5 to 1 × 10^9/L)
- Severe: < 500/mcL (< 0.5 × 10^9/L)
Primary defects in neutrophil function involve failures in adhering to endothelial cells, abnormal chemotaxis, inadequate bacterial ingestion and killing, insufficient production of microbicidal compounds, defective formation of phagolysosomes, and diminished synthesis of toxic reactive oxygen species. Common infections in individuals with profound neutropenia include cellulitis, furunculosis, pneumonia, sepsis, and sinusitis. Neutropenia is typically asymptomatic until an infection arises, with fever being a standard indicator. Severe neutropenia may obscure typical signs of inflammation, and focal symptoms, such as oral ulcers, can be subtle. Drug-induced neutropenia may present with fever, rash, and lymphadenopathy due to hypersensitivity reactions. Neutropenia can be distinguished from antibody deficiency disorders, where immunoglobulin levels are below normal or absent, leading to recurrent bacterial and fungal infections. The complement system deficiency, like C3 deficiency, can mimic neutropenia but can be differentiated through quantification and functional assessment. The prognosis in neutropenia disorders varies based on the cause and affected organs. Chronic Granulomatous Disease (CGD) has a better prognosis with successful allogeneic bone marrow transplantation. Neutropenia induced by chemotherapy or drugs may be remitted after treatment cessation. Some primary neutrophil function defects can lead to fatal diseases and premature death.
- The estimated prevalence of neutropenia is 1.24%, corresponding to approximately 35.5 million individuals in the United States.
Geography Covered:
North America- the United States and Canada
Europe- EU5 (Germany, France, Italy, Spain, and the United Kingdom)
Other countries- Japan & China
Study Period: 2021-2032
Current Clinical Practice and Treatment Algorithm
This section of the study covers country-specific current clinical practice, the standard of care, and significant limitations around addressing the unmet needs. Retrospective analysis and bench-marking of clinical study outcomes are presented in terms of Pre-treatment & post-treatment clinical and demographic patient characteristics. Essentially, this section will cover the evolution of the current competitive landscape and its impact on the future treatment paradigm.
KOL Insights:
KOLs across 8 MM markets from the center of Excellence/ Public/ Private hospitals participated in the study. Insights around current treatment landscape, epidemiology, clinical characteristics, future treatment paradigm, and Unmet needs
Market Forecast: Patient Based Forecast Model (MS. Excel Based Automated Dashboard)
– Data Inputs with sourcing
– Market Event and Product Event
– Country-specific Forecast Model
– Market uptake and patient share uptake
– Attribute Analysis
– Analog Analysis
– Disease burden and pricing scenario
– Summary and Insights
NPV/ IRR Calculator-
Optimization of cash flow/ revenue flow concerning all fixed and variable investments throughout the product development process. The rate of return on an investment is a critical indicator to ensure the profitability and break-even of the project.
Competitive Landscape:
The competitive landscape includes country-specific approved as well as pipeline therapies. Any asset/product-specific designation or review such as Orphan drug designation, Fast track, Priority Review, Breakthrough Therapy Designation, Rare Pediatric Disease Designation, and Accelerated Approval are tracked and supplemented with analyst commentary.
Clinical Trial Assessment-
Detailed clinical trial data analysis and critical product positioning include trial design, primary outcomes, secondary outcomes, dosing and schedules, inclusion and exclusion criteria, recruitment status and essentially covers the reported adverse events. Majorly the trial analysis helps determine the potential of the critical assets and their probable filing and launch date.
Unmet Medical Needs Overview-
This report presents the most important clinical unmet needs in the treatment, according to Thelansis research and analysis. Other essential unmet needs identified through our study include decreased cost burden on patients, improved administration convenience, and improved patient compliance.
Visit our social media pages:
Neutropenia Competitive Landscape
| S. no | Asset | Company | Stage |
| 1 | Ryzneuta (efbemalenograstim alfa) | EVIVE Biotechnology | Phase 3 |
| 2 | Mavorixafor | X4 Pharmaceuticals | Phase 3 |
| 3 | EC-18 | Enzychem Lifesciences Corporation | Phase 2 |
| 4 | Plinabulin+Pegfilgrastim | BeyondSpring Pharmaceuticals Inc. | Phase 3 |
| 5 | Eflapegrastim | Spectrum Pharmaceuticals, Inc | Phase 1 |
| 6 | MW05 | Mabwell (Shanghai) Bioscience Co., Ltd. | Phase 3 |
| 7 | Trilaciclib | G1 Therapeutics, Inc. | Phase 2 |
| 8 | AmBisome and DKF-5122 | Dongkook Pharmaceutical Co., Ltd. | Phase 1 |
| 9 | YPEG-rhG-CSF | Xiamen Amoytop Biotech Co., Ltd. | Phase 3 |
KOLs across 8 MM market from the center of Excellence/ Public/ Private hospitals participated in the study. Insights around current treatment landscape, epidemiology, clinical characteristics, future treatment paradigm, and Unmet needs.
| COUNTRY | No. Of KOLs |
| USA | 17 |
| GERMANY | 4 |
| UK | 4 |
| SPAIN | 3 |
| FRANCE | 2 |
| ITALY | 3 |
| JAPAN | 3 |
| CHINA | 4 |
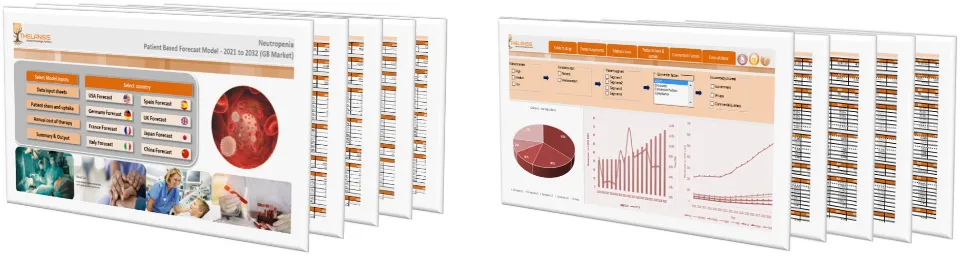
Neutropenia Market Forecast: Patient Based Forecast Model (MS. Excel Based Automated Dashboard)
Data Inputs with sourcing, Market Event, Product Event, Country specific Forecast Model, Market uptake and patient share uptake, Attribute Analysis, Analog Analysis, Disease burden, and pricing scenario, Summary, and Insights.
1. Neutropenia – Key Findings Summary |
| 1.1. Clinical findings |
| 1.1.1. Disease overview |
| 1.1.2. Therapeutic practices |
| 1.1.3. Future outlook |
| 1.2. Commercial findings |
| 1.2.1. Neutropenia market scenario 2021 |
| 1.2.2. Neutropenia market scenario 2025 |
| 1.2.3. Neutropenia market scenario 2032 |
2. Neutropenia Overview |
| 2.1. Disease Introduction |
| 2.2. Pathophysiology |
| 2.3. Signs and Symptoms |
| 2.4. Risk Factors |
| 2.5. Etiology |
| 2.6. Classification |
| 2.7. Pathogenesis |
| 2.8. Diagnosis |
| 2.9. Complications |
| 2.10. Treatment Algorithm |
| 2.10.1. Treatment in US (guidelines) |
| 2.10.2. Treatment in EU-5 (guidelines) |
| 2.10.3. Treatment in Japan (guidelines) |
| 2.10.4. Treatment in China (guidelines) |
| 2.11. Treatment Goals for Neutropenia |
| 2.12. Referral Patterns |
| 2.12.1. Referral Scenario in US |
| 2.12.2. Referral Scenario in EU-5 |
| 2.12.3. Referral Scenario in Japan |
| 2.12.4. Referral Scenario in China |
| 2.13. Neutropenia Prognosis |
| 2.14. Healthcare burden |
| 2.14.1. Healthcare burden in US |
| 2.14.2. Healthcare burden in EU-5 |
| 2.14.3. Healthcare burden in Japan |
| 2.14.4. Healthcare burden in China |
| 2.15. Unmet Needs in Neutropenia management |
| 2.16. Market Opportunity for Neutropenia |
| 2.17. KOL Comments on current and upcoming/expected treatment practices in Neutropenia |
3. Epidemiology |
| 3.1. Epidemiology Overview |
| 3.2. Epidemiology by Geography |
| 3.2.1. Neutropenia Epidemiology in US (2021-2032) |
| 3.2.1.1. Incidence of Neutropenia |
| 3.2.1.2. Diagnosed cases |
| 3.2.1.3. Treatable Patient Pool |
| 3.2.1.4. Epidemiology Trends |
| 3.2.2. Neutropenia Epidemiology in EU-5 (2021-2032) |
| 3.2.2.1. Incidence of Neutropenia |
| 3.2.2.2. Diagnosed cases |
| 3.2.2.3. Treatable Patient Pool |
| 3.2.2.4. Epidemiology Trends |
| 3.2.3. Neutropenia Epidemiology in Japan (2021-2032) |
| 3.2.3.1. Incidence of Neutropenia |
| 3.2.3.2. Diagnosed cases |
| 3.2.3.3. Treatable Patient Pool |
| 3.2.3.4. Epidemiology Trends |
| 3.2.4. Neutropenia Epidemiology in China (2021-2032) |
| 3.2.4.1. Incidence of Neutropenia |
| 3.2.4.2. Diagnosed cases |
| 3.2.4.3. Treatable Patient Pool |
| 3.2.4.4. Epidemiology Trends |
| 3.3. Epidemiology Trends (World-wide) |
4. Market Outlook |
| 4.1. US Neutropenia Market Forecast 2021-2032 |
| 4.1.1. Market Progression (Futuristic) |
| 4.1.2. Market Trends and Expectations |
| 4.1.2.1. Worst case scenario |
| 4.1.2.2. Base Case Scenario |
| 4.1.2.3. Best Case Scenario |
| 4.1.3. Drivers and Barriers |
| 4.2. UK Neutropenia Market Forecast 2021-2032 |
| 4.2.1. Market Progression (Futuristic) |
| 4.2.2. Market Trends and Expectations |
| 4.2.2.1. Worst case scenario |
| 4.2.2.2. Base Case Scenario |
| 4.2.2.3. Best Case Scenario |
| 4.2.3. Drivers and Barriers |
| 4.3. France Neutropenia Market Forecast 2021-2032 |
| 4.3.1. Market Progression (Futuristic) |
| 4.3.2. Market Trends and Expectations |
| 4.3.2.1. Worst case scenario |
| 4.3.2.2. Base Case Scenario |
| 4.3.2.3. Best Case Scenario |
| 4.3.3. Drivers and Barriers |
| 4.4. Germany Neutropenia Market Forecast 2021-2032 |
| 4.4.1. Market Progression (Futuristic) |
| 4.4.2. Market Trends and Expectations |
| 4.4.2.1. Worst case scenario |
| 4.4.2.2. Base Case Scenario |
| 4.4.2.3. Best Case Scenario |
| 4.4.3. Drivers and Barriers |
| 4.5. Italy Neutropenia Market Forecast 2021-2032 |
| 4.5.1. Market Progression (Futuristic) |
| 4.5.2. Market Trends and Expectations |
| 4.5.2.1. Worst case scenario |
| 4.5.2.2. Base Case Scenario |
| 4.5.2.3. Best Case Scenario |
| 4.5.3. Drivers and Barriers |
| 4.6. Spain Neutropenia Market Forecast 2021-2032 |
| 4.6.1. Market Progression (Futuristic) |
| 4.6.2. Market Trends and Expectations |
| 4.6.2.1. Worst case scenario |
| 4.6.2.2. Base Case Scenario |
| 4.6.2.3. Best Case Scenario |
| 4.6.3. Drivers and Barriers |
| 4.7. Japan Neutropenia Market Forecast 2021-2032 |
| 4.7.1. Market Progression (Futuristic) |
| 4.7.2. Market Trends and Expectations |
| 4.7.2.1. Worst case scenario |
| 4.7.2.2. Base Case Scenario |
| 4.7.2.3. Best Case Scenario |
| 4.7.3. Drivers and Barriers |
| 4.8. China Neutropenia Market Forecast 2021-2032 |
| 4.8.1. Market Progression (Futuristic) |
| 4.8.2. Market Trends and Expectations |
| 4.8.2.1. Worst case scenario |
| 4.8.2.2. Base Case Scenario |
| 4.8.2.3. Best Case Scenario |
| 4.8.3. Drivers and Barriers |
| 4.9. Key Expected Milestones (world-wide) Impacting the Market |
5. Competitive Landscape |
| 5.1. Pipeline Therapies Overview |
| 5.1.1. Phase III Therapies |
| 5.1.1.1. Current Status |
| 5.1.1.2. Trial details, results |
| 5.1.1.3. Approval Timeline |
| 5.1.1.4. Likelihood of approval |
| 5.1.1.5. Expected Product Positioning |
| 5.1.1.2. All other Phase III Therapies ….. |
| 5.1.1.3. Attribute Analysis of Phase III molecules |
| 5.1.2. Phase II and Phase I/II Therapies |
| 5.1.2.1. Current Status |
| 5.1.2.2. Trial details, results |
| 5.1.2.3. Approval Timelines |
| 5.1.3. List of active Pre-clinical Therapies |
| 5.1.3.1. Status in Neutropenia |
| 5.1.3.2. Company positioning |
| 5.1.3.2. All other pre-clinical therapies |
| 5.1.4. List of Inactive/discontinued assets |
| 5.1.4.1. Business impact of discontinuations on current pipeline |
| 5.1.5. Potential winners from Neutropenia Pipeline |
| 5.1.5.1. Potential Blockbusters across the pipeline |
6. Regulatory/Approval Scenario |
| 6.1. Regulatory/Approval Framework in US |
| 6.1.1. Policy Framework |
| 6.1.2. Payer Expectations |
| 6.2. Regulatory/Approval Framework in UK |
| 6.2.1. Policy Framework |
| 6.2.2. Payer Expectations |
| 6.3. Regulatory/Approval Framework in France |
| 6.3.1. Policy Framework |
| 6.3.2. Payer Expectations |
| 6.4. Regulatory/Approval Framework in Germany |
| 6.4.1. Policy Framework |
| 6.4.2. Payer Expectations |
| 6.5. Regulatory/Approval Framework in Italy |
| 6.5.1. Policy Framework |
| 6.5.2. Payer Expectations |
| 6.6. Regulatory/Approval Framework in Spain |
| 6.6.1. Policy Framework |
| 6.6.2. Payer Expectations |
| 6.7. Regulatory/Approval Framework in Japan |
| 6.7.1. Policy Framework |
| 6.7.2. Payer Expectations |
| 6.8. Regulatory/Approval Framework in China |
| 6.8.1. Policy Framework |
| 6.8.2. Payer Expectations |
7. Clinical Trial Assessment – Current and Future Paradigm |
| 7.1. Distribution of Primary Endpoints across trials |
| 7.2. Distribution of Secondary Endpoints across trials |
| 7.3. Evolution and acceptance of surrogate endpoints |
| 7.4. Key Investigator initiated trials |
| 7.5. Attrition analysis |
| 7.5.1. Suspended/Discontinued Assets |
| 7.5.2. Failed Trials, Reasons and Business Impact |
| 7.5.3. Terminated Trials, Reasons and Business Impact |
| 7.5.4. Withdrawn Trials, Reasons and Business Impact |
| 7.6. Trial enrollment scenario and challenges |
| 7.7. Clinical Trial Guidance (across geographies) |
8. Thelansis Commentary |
| 8.1. Key Unmet needs in Neutropenia |
| 8.2. Possible Best-case Clinical Trial Strategies |
| 8.3. Possible Best Case Targeted Product Profile (TPP) |
| 8.4. Possible Best-case Market positioning strategies |
| 8.5. Possible Best-case Market Access Strategies |
| 8.6. Possible Best-case LCM Strategies |
| 8.7. Overall View on Neutropenia Market in Dollar Value |
9. Report Methodology |
| 9.1. Secondary research |
| 9.2. Primary research |
| 9.3. Data collation |
| 9.4. Insight Generation |
10. About Thelansis |
| 10.1. Our Capabilities |
| 10.2. Our Services |
| 10.3. Our Contacts |
| 10.4. Disclaimer |