
Sep 16 2026
/
Pharma Launch Forecasting: From Static Annual Models to Real-Time Commercial Intelligence
Background:
A global specialty pharmaceutical company was approaching the launch of a new chronic-therapy asset in a market characterized by heavy competition. The compound had strong clinical differentiation, but the commercial environment around it was rapidly changing: multiple competitors were entering the same treatment class within a 12-18 month window, payer formulary criteria were being revised on a rolling basis, and pricing pressure was intensifying across both public and private payer channels.
Historically, the company had planned launches using a traditional annual forecasting cycle, built and maintained in spreadsheets. This approach had served earlier, more stable launches reasonably well. But it was not designed for a market moving on a weekly or monthly cadence. The updates were slow, assumptions were static, and every major forecast revision required weeks of manual work across multiple teams.
As leadership prepared to commit supply, sales force, and marketing investment ahead of launch, they needed a forecasting capability that reflected what the market was actually doing, not what had been assumed six months earlier at the last planning cycle.
The Problem:
Three structural limitations in the existing forecasting approach were identified during the pre-launch readiness review:
1. Static assumptions in a dynamic market
The annual forecast was rebuilt roughly once or twice a year, with interim adjustments made manually and inconsistently. A single major revision, incorporating a new competitor entry or a formulary change, typically took four to six weeks to complete across the finance, market access, and commercial analytics teams. In a market where competitive and access events were occurring on a near-monthly basis, this update cycle meant the forecast was structurally always behind the market it was meant to describe.
2. Limited visibility into real-world uptake
The model relied primarily on internal assumptions and historical analogue launches, with minimal integration of live prescription, claims, or payer-access data. As a result, leadership lacked a clear view of whether adoption was tracking above or below expectations.
3. No early warning system for commercial risk
There was no systematic process for detecting early signals of slower-than-expected uptake, emerging access barriers, or competitive share erosion. Commercial and market access teams typically became aware of a problem only after it had already shown up in quarterly revenue, by which point the window for corrective action (targeting adjustments, contracting moves, messaging changes) had narrowed considerably.
Taken together, these gaps meant that a forecast intended to guide near-term commercial decisions was, in practice, reflecting market conditions that were already one to two quarters out of date by the time decisions were made against it.
The Approach:
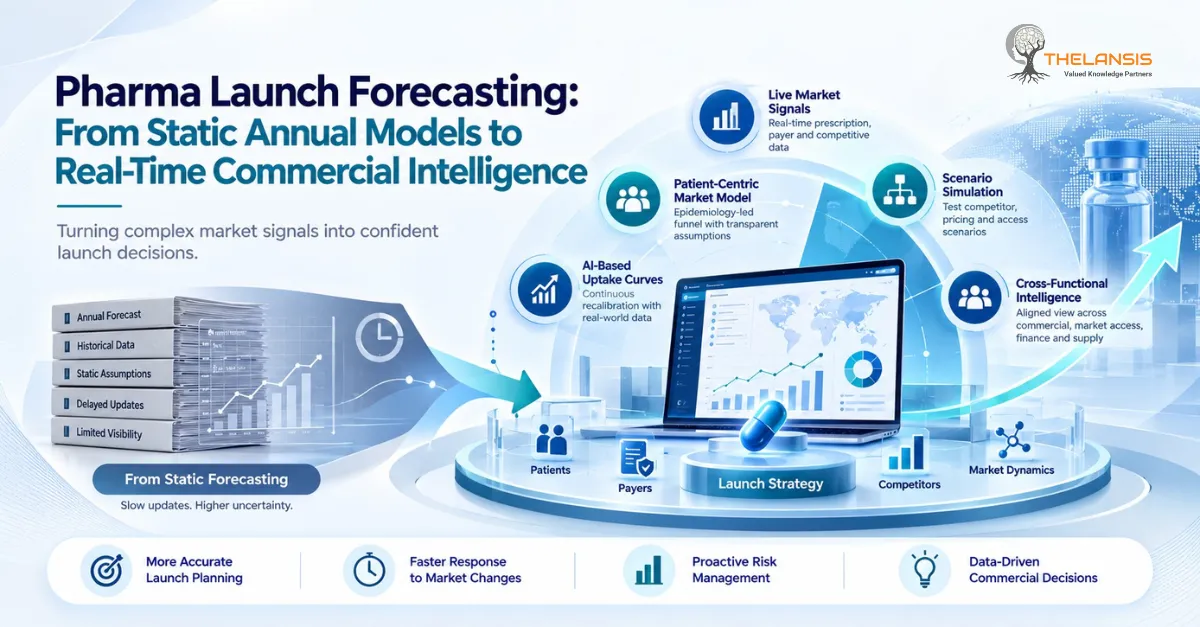
Thelansis’s market forecasting approach was built around a central premise: forecasting in a fast-moving therapy area should function less like a static annual model and more like a continuously updating commercial intelligence platform. This required rethinking both the structure of the model and the process by which it was maintained.
The methodology proceeded in four stages:
Stage 1 — Diagnose the decision, not just the data gap
Before rebuilding the model, we mapped which specific commercial decisions the forecast was meant to inform (supply planning, field force deployment, contracting strategy, marketing spend pacing) and the decision cadence each one required. This determined how frequently different parts of the model needed to refresh; some elements needed weekly updates, others monthly or quarterly.
Stage 2 — Rebuild the model on an epidemiology-led patient funnel
Rather than starting from historical analogue revenue curves, we reconstructed the forecast bottom-up: disease prevalence → diagnosed population → treated population → line-of-therapy eligibility → treatment duration and persistence → revenue.
This created a transparent, auditable link between epidemiological reality and every dollar in the forecast, so that any variance could be traced back to a specific point in the patient funnel rather than treated as an unexplained deviation.
Stage 3 — Identify and integrate live market-signal sources
We evaluated available real-world data sources for reliability, latency, and coverage, and selected a combination of weekly prescription data, claims-based patient tracking, regional payer-access status feeds, channel distribution data, and structured competitive-event tracking (launches, label changes, pricing actions). Each source was mapped to the specific funnel stage it was best positioned to inform.
Stage 4 — Design for scenario testing, not just tracking
The model was built so that commercial teams could not only monitor current performance but simulate forward-looking scenarios: a competitor launch, a price change, a formulary win or loss, and see the projected impact on patient starts, switching, and revenue before the event occurred, not just after.
The Solution:
The resulting solution was a dynamic forecasting engine with four core components:
- Patient-centric market model: an epidemiology-led funnel replacing static analogue-based revenue curves, giving every forecast line item a transparent derivation path back to patient counts.
- Live market-signal integration: automated ingestion of weekly prescription, claims, access, and competitive-event data, replacing the prior practice of manual, periodic data pulls.
- AI-based uptake curves: models that continuously recalibrate patient starts, switching behavior, persistence, and regional adoption patterns based on incoming real-world data, replacing fixed uptake-curve assumptions set once at launch.
- Scenario simulation layer: an interface allowing commercial, market access, and finance teams to run “what-if” scenarios and see revenue and share impact in real time, rather than waiting for the next scheduled forecast cycle.
Critically, the solution was implemented as a shift in operating process as well as tooling: forecast ownership moved from being a finance-only exercise to a shared commercial intelligence system with defined update responsibilities across marketing, market access, sales, supply chain, and finance.
Results and Impact:
Within six months of implementation, the legacy forecasting process had been fully replaced. Measured impact included:
The practical value of the system was demonstrated directly when a competitor launched earlier than the base-case assumption had anticipated. The model reflected the resulting impact on switching behavior and new-patient starts immediately, giving the commercial team the ability to adjust targeting and contracting strategy within weeks, a response window that would previously have taken a full quarter or more under the legacy process.
Reflective Analysis: Why It Worked, and What It Suggests Going Forward
Why the solution worked. The forecasting engine’s effectiveness did not come primarily from the machine-learning component, but from the sequencing of the redesign: rebuilding the funnel on epidemiological logic first gave the model structural integrity, so that when real-world data was layered on top, deviations could be interpreted (a specific funnel stage moving off-plan) rather than merely observed (revenue is off-plan, cause unknown). Organizations that skip the funnel-rebuild step and simply bolt live data feeds onto a legacy revenue-curve model tend to gain speed without gaining explanatory power: they can see that something changed faster, but not why.
Lessons Learned:
- Forecast cadence should be decision-driven, not calendar-driven: different commercial decisions warrant different refresh frequencies, and treating “the forecast” as a single object with one update schedule undersells the value of real-time data.
- Cross-functional ownership was as important as the technical build. A more accurate model delivered to a finance-only audience would have replicated the same reaction-lag problem one layer down.
- Scenario simulation proved to be the feature commercial teams used most in practice, the ability to pressure-test a decision before committing to it changed planning behavior in a way that passive dashboards did not.
Future Directions:
The same architecture (epidemiology-led funnel plus live signal integration plus scenario simulation) extends naturally to earlier-stage decisions: pre-launch investment sizing, indication-expansion planning, and comparative scenario analysis across multiple pipeline assets competing for the same commercial resources. The more structurally significant shift, though, is organizational: once a commercial team has experienced a forecast that updates with the market rather than after it, the annual static forecast becomes difficult to justify as the primary planning tool for any asset in a fast-moving therapeutic area.
To learn more about Thelansis’s market forecasting capabilities, or to explore long-range disease-level views, see our Market Outlook and Forecast reports.