Jan 16 2026
/
How Thelansis helped a Pharma company mitigate LOE impact through Forecast Modelling & Market Analytics
Background:
In 2024, a mid-size specialty pharma company approached Thelansis with a clear challenge: its hero product, a second-line therapy in a tightly contested market, was set to enter Loss of Exclusivity (LOE) in about 18 months. The drug accounted for 38% of the company’s global revenue, with the US and EU5 markets accounting for most of that.
Internally, the company was working with scattered market intelligence, varying epidemiology assumptions, and no single framework to gauge the real impact of LOE. The leadership team needed a clearer picture of:
- How much revenue erosion is expected in each market?
- When generics were likely to enter, and how aggressively they might compete?
- How demand might shift under different pricing pressures?
- Which commercial or access levers could soften the decline?
- What could this mean for the broader portfolio?
Thelansis was engaged to build a robust, decision-ready LOE Forecast Framework that stitched together real-world market dynamics with predictive modelling.
Engagement Objectives:
- Quantify LOE impact over a 5-8 year horizon using epidemiology-aligned forecast modelling
- Simulate generic entry scenarios (fast, moderate, delayed, staggered multi-entrant scenarios)
- Identify competitive vulnerabilities across market segments, payer archetypes, and prescriber behaviour
- Build an interactive model enabling the client’s commercial and finance teams to test assumptions in real time
- Provide evidence-backed recommendations to sustain revenue and strengthen post LOE positioning
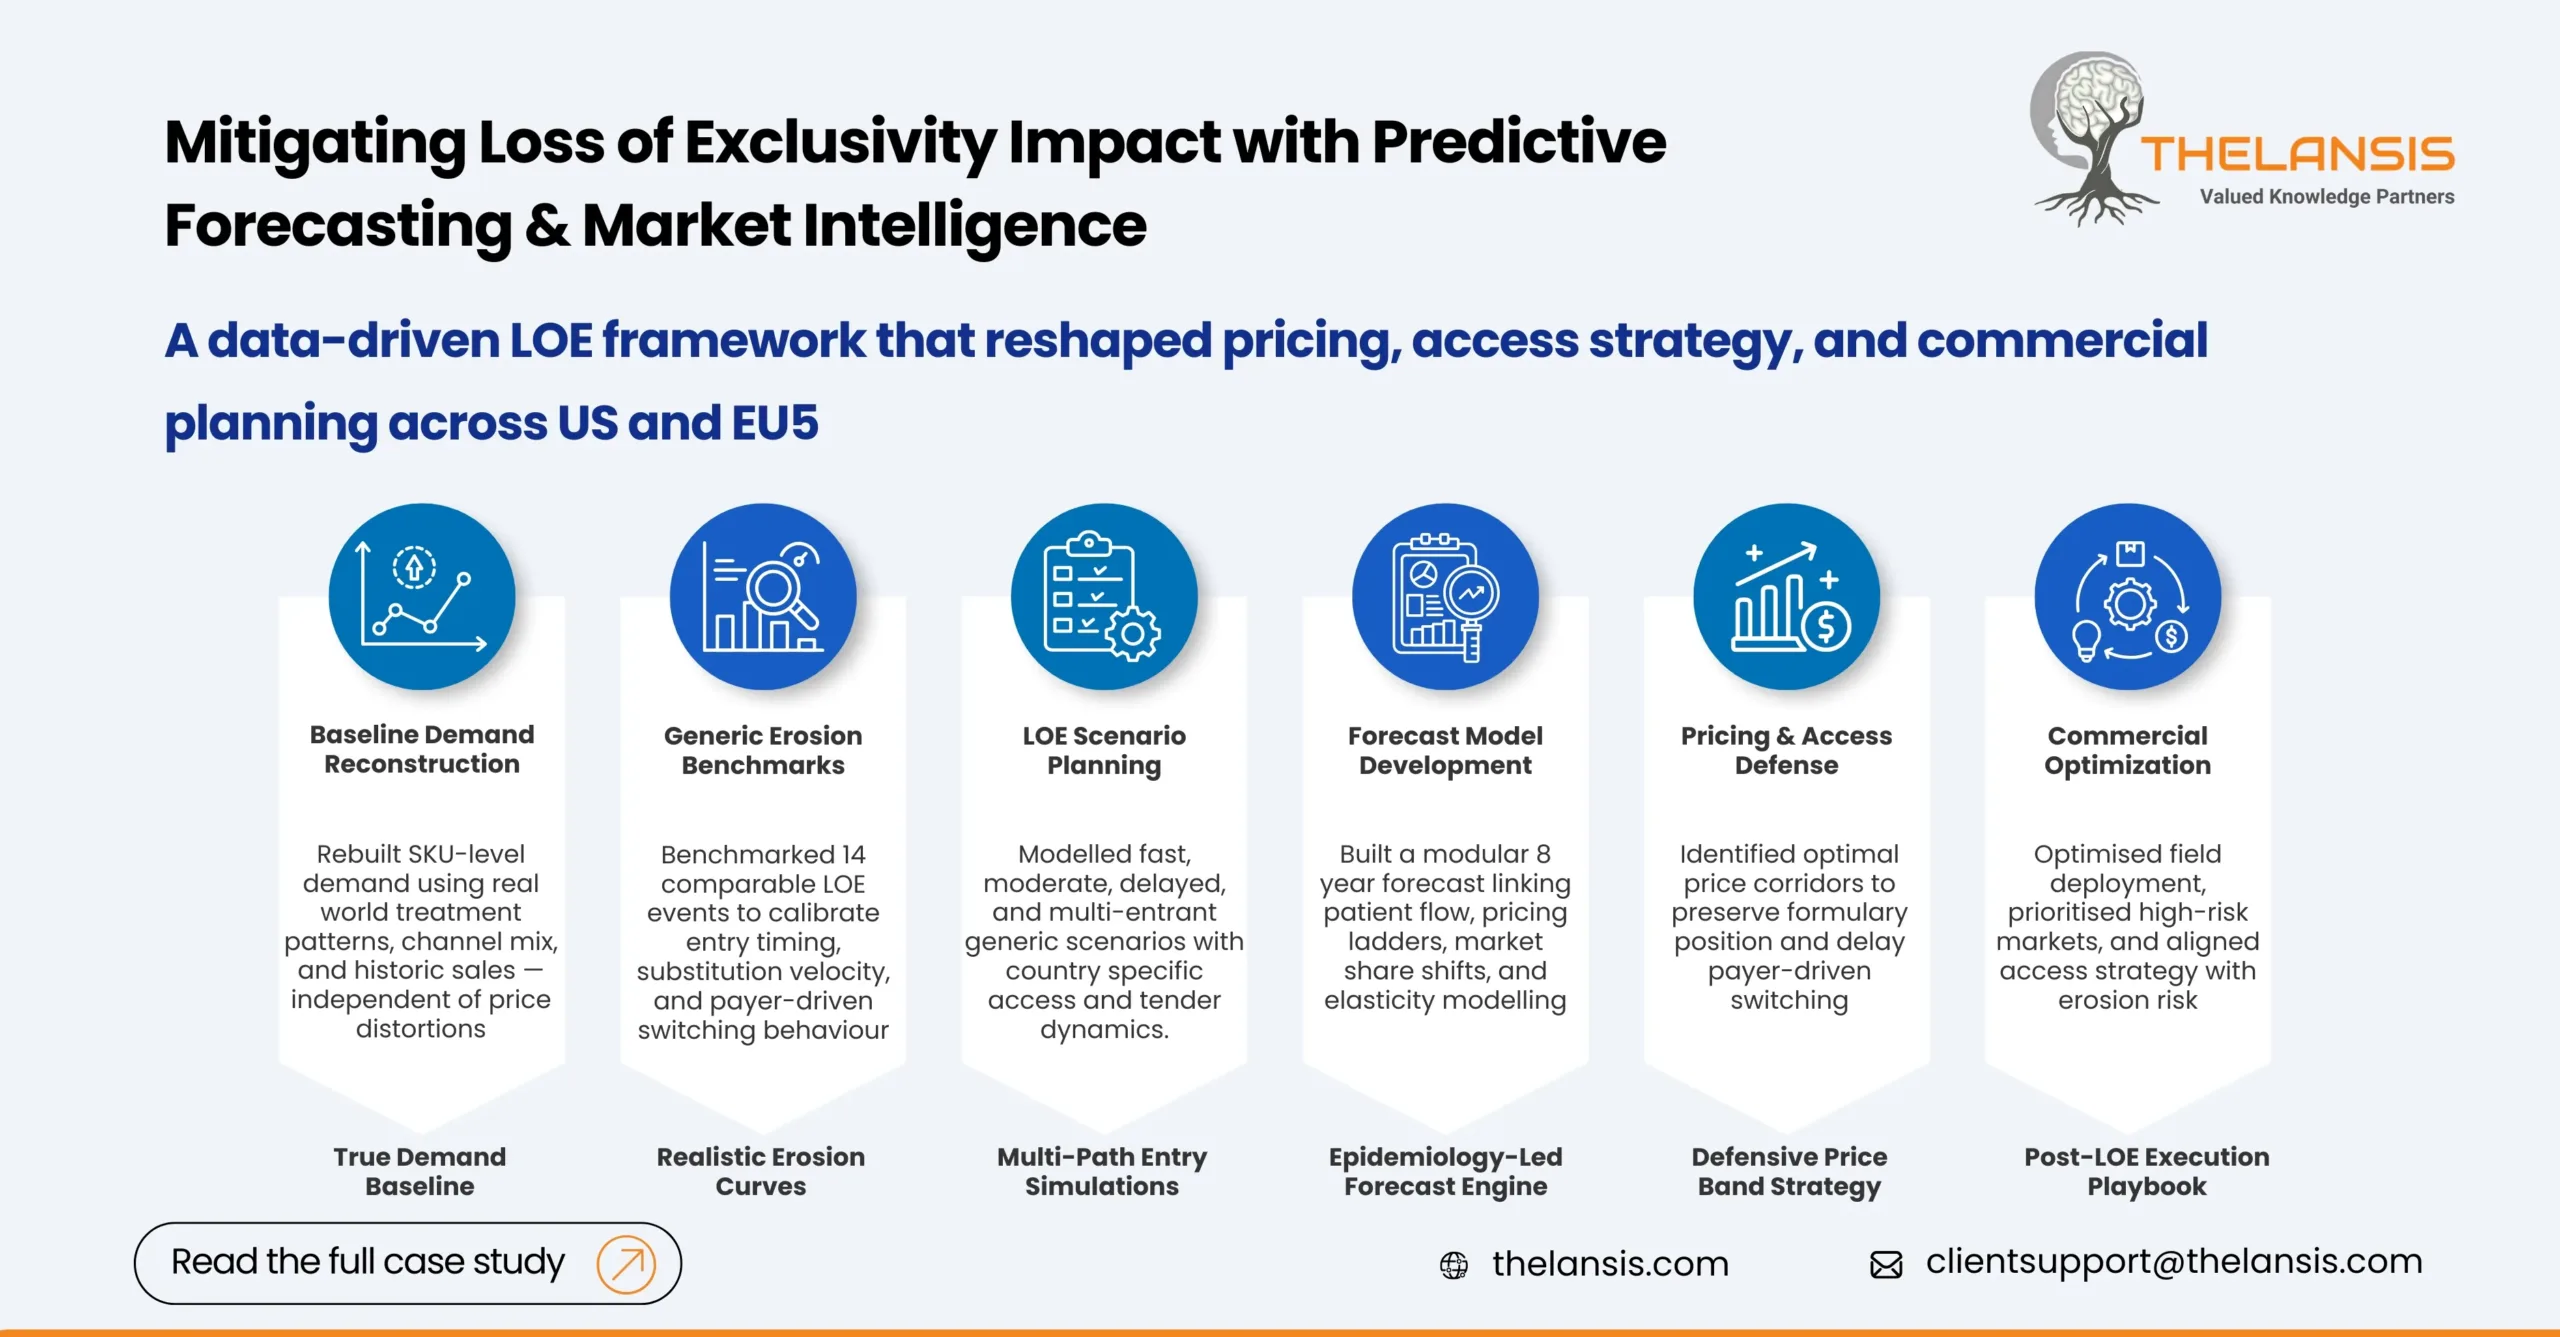
Approach & Methodology:
1. Baseline Demand Reconstruction
The first challenge was data fragmentation. We consolidated:
- Historical sales by geography (SKU-level)
- Channel mix and payer access trends
- Real-world treatment patterns from syndicated data
- Epidemiology estimates harmonized using Thelansis’ disease burden matrix
- Competitor pricing corridors from the last eight LOE events within the therapy area
This allowed us to rebuild a true demand baseline, independent of pricing or stocking distortions, which was critical for LOE forecasting.
2. Generic Erosion Benchmarks
Using our proprietary LOE analytics library, we compared:
- Median erosion curves across 14 similar molecules
- Regulator-driven timelines for ANDA approvals
- Entry sequencing by market (notably, the US typically sees 3-6 entrants within the first 12 months; the EU follows a staggered, country-by-country pattern)
- Historic payer-switching elasticity
This helped us calibrate realistic erosion coefficients rather than rely on generic industry heuristics.
3. Scenario Planning Framework
We designed three core LOE scenarios, each backed by regulatory and competitive intelligence:
Base Case: Three Generic Entrants in Year 1
Expected erosion: 52-57% in the first 12 months
Accelerated Case: Early Filers + Price War
Erosion up to 68% with rapid substitution triggered by aggressive PBM contracting
Delayed Case: Patent Challenges Unsuccessful / Supply Constraints
Erosion limited to ~35% with a recovery tail in EU markets
Each scenario integrated country-specific payer behaviour, physician adherence to branded products, and switch dynamics observed in previous analogues.
4. Forecast Model Development
Thelansis delivered a forecast model built on modular components:
- Epidemiology linked patient flow
- Pricing module with discount ladders for brand vs. generics
- Market share simulator for each entrant
- Elasticity calculator for payer-driven step edits
- Volume sensitivity matrix for KAM and field strategy
This enabled the client’s teams to adjust assumptions in real time and visualize financial outcomes across multiple market conditions.
Key Insights Delivered:
1. LOE Impact was Overestimated by ~22%
Initial internal assumptions projected a steep cliff. Our modelling showed a slower erosion curve in EU markets, due to:
- Limited parallel trade
- Lower immediate substitution in hospital-driven channels
- Country-specific tender cycles that delayed generic penetration
This alone prevented a premature withdrawal of promotional efforts.
2. Two Markets drove 70% of the Downside Risk
Contrary to expectations, risk was not uniform:
- US: Highly sensitive to PBM decisions, one aggressive PBM contract shift could create $60-80M annualized erosion
- Germany & Italy: Tender cycles would determine timing of generic uptake more than price levels
This insight refocused resources on the highest risk geographies.
3. A Pricing-Access Strategy could Recover 8-11% of Lost Value
By modelling price corridors and payer elasticity, we identified a “defensive price band” where:
- The brand maintained formulary presence
- Payers delayed switching due to limited incremental savings
- HCPs maintained a stability preference for chronic treatment patients
- This translates to ~$95M in value preservation over five years
Impact:
In six months of model deployment, the company:
- Revised its annual operating plan with data-backed LOE assumptions
- Secured two critical access agreements pre-emptively in the US and EU
- Optimized field force deployment, reducing low-yield territories
- Adjusted pricing strategy, which aligned with the “defensive band” identified