Published Date : 2023-04-07
Published Date : 2023-04-07
Updated On : 2024-02-11
Pages : 152
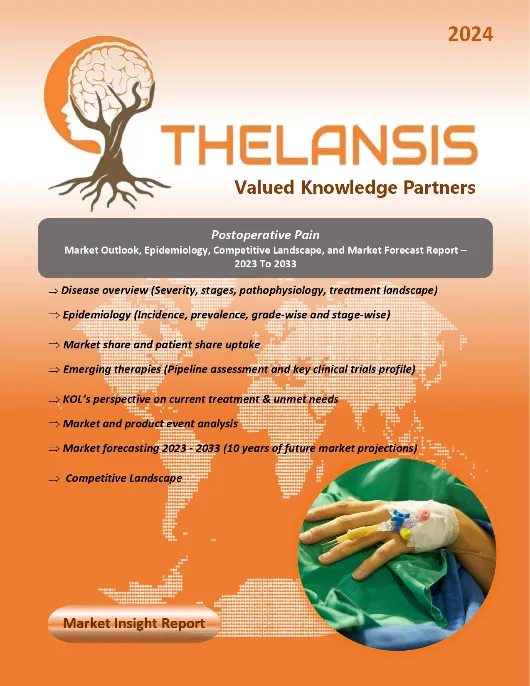
Thelansis’s “Postoperative Pain Market Outlook, Epidemiology, Competitive Landscape, and Market Forecast Report – 2023 To 2033" covers disease overview, epidemiology, drug utilization, prescription share analysis, competitive landscape, clinical practice, regulatory landscape, patient share, market uptake, market forecast, and key market insights under the potential Postoperative Pain treatment modalities options for eight major markets (USA, Germany, France, Italy, Spain, UK, Japan, and China).
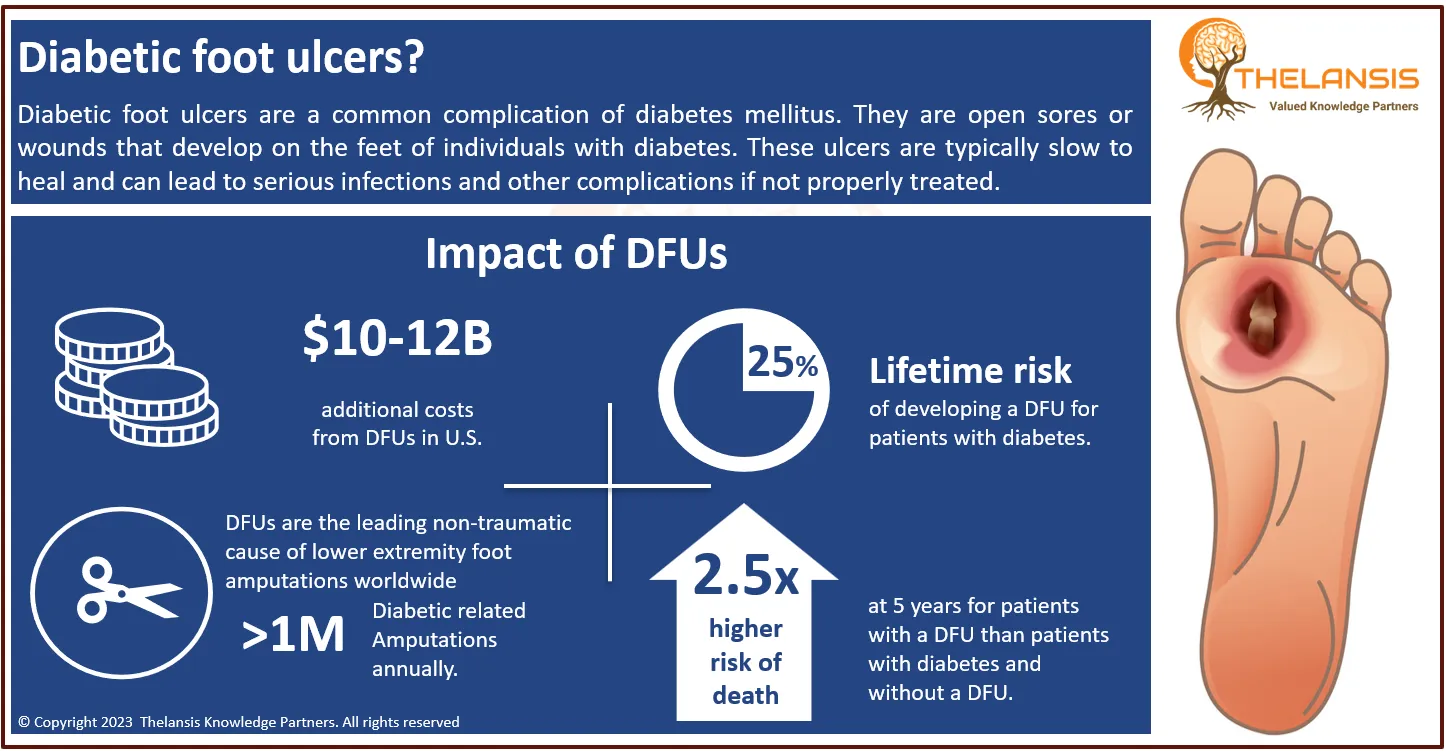
Postoperative pain throughout the body encompasses discomfort experienced across various areas, including joints, muscles, head, and limbs, often accompanied by restlessness, insomnia, sweating irregularities, fatigue, reduced appetite, and sometimes limb dysfunction. This type of pain typically emerges following significant surgical procedures, sometimes exacerbating pre-existing generalized body pain. Its intensity peaks within 24-48 hours post-surgery and gradually diminishes as the surgical site heals. In about 10% of surgical cases, acute postoperative pain can transition to chronic postsurgical pain, characterized by neuropathic features that are resistant to opioid treatment. Chronic body-wide pain, especially in the entire back, may also manifest, sometimes worsening acutely post-operation. Symptoms may include headaches, a stiff neck, joint pain, cold intolerance, mild fever, and specific pulse irregularities, notably at the Lung position. Inadequate management of postoperative pain can impede recovery, functional capabilities, and overall quality of life, elevating the risk of persistent pain and surgical complications. Pharmacological approaches to pain management may entail temporary escalation of opioid analgesics and the utilization of continuous regional block techniques immediately post-surgery.
North America- the United States and Canada
Europe- EU5 (Germany, France, Italy, Spain, and the United Kingdom)
Other countries- Japan & China
This section of the study covers country-specific current clinical practice, the standard of care, and significant limitations around addressing the unmet needs. Retrospective analysis and bench-marking of clinical study outcomes are presented in terms of Pre-treatment & post-treatment clinical and demographic patient characteristics. Essentially, this section will cover the evolution of the current competitive landscape and its impact on the future treatment paradigm.
KOLs across 8 MM markets from the center of Excellence/ Public/ Private hospitals participated in the study. Insights around current treatment landscape, epidemiology, clinical characteristics, future treatment paradigm, and Unmet needs
- Data Inputs with sourcing
- Market Event and Product Event
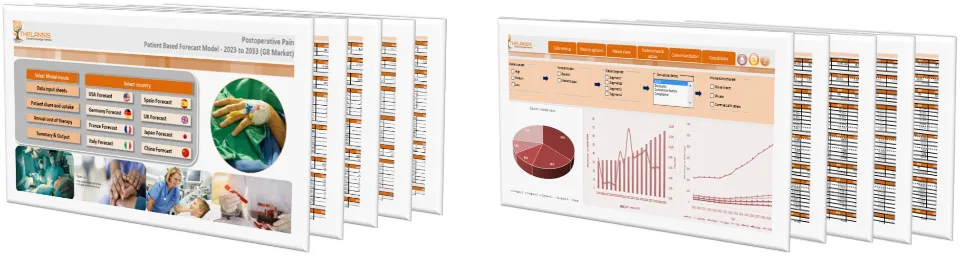
- Country-specific Forecast Model
- Market uptake and patient share uptake
- Attribute Analysis
- Analog Analysis
- Disease burden and pricing scenario
- Summary and Insights
Optimization of cash flow/ revenue flow concerning all fixed and variable investments throughout the product development process. The rate of return on an investment is a critical indicator to ensure the profitability and break-even of the project.
The competitive landscape includes country-specific approved as well as pipeline therapies. Any asset/product-specific designation or review such as Orphan drug designation, Fast track, Priority Review, Breakthrough Therapy Designation, Rare Pediatric Disease Designation, and Accelerated Approval are tracked and supplemented with analyst commentary.
Detailed clinical trial data analysis and critical product positioning include trial design, primary outcomes, secondary outcomes, dosing and schedules, inclusion and exclusion criteria, recruitment status and essentially covers the reported adverse events. Majorly the trial analysis helps determine the potential of the critical assets and their probable filing and launch date.
This report presents the most important clinical unmet needs in the treatment, according to Thelansis research and analysis. Other essential unmet needs identified through our study include decreased cost burden on patients, improved administration convenience, and improved patient compliance.


| S. no | Asset | Company | Stage |
| 1 | SABER-Bupivacaine | Durect | Phase 3 |
| 2 | Tetrahydrocannabinol | Global Blood Therapeutics | Phase 2/3 |
| 3 | Morphine 6-glucuronide and Morphine | Paion UK Ltd. | Phase 3 |
| 4 | DIC075V | Vertex Pharmaceuticals Incorporated | Phase 3 |
| 5 | VVZ-149 | Vivozon, Inc. | Phase 2/3 |
| 6 | ACP-044 | ACADIA Pharmaceuticals Inc. | Phase 2 |
| 7 | TLC590 | Taiwan Liposome Company | Phase 2/3 |
| 8 | MR-107A-02 | Viatris Inc. | Phase 3 |
| 9 | ST-01 | Sustained Therapeutics Inc. | Phase 2 |
| 10 | APSCTC | Apsen Farmaceutica S.A. | Phase 3 |
Continued...
KOLs across 8 MM market from the center of Excellence/ Public/ Private hospitals participated in the study. Insights around current treatment landscape, epidemiology, clinical characteristics, future treatment paradigm, and Unmet needs.
| COUNTRY | No. Of KOLs |
| USA | 17 |
| GERMANY | 4 |
| UK | 4 |
| SPAIN | 3 |
| FRANCE | 2 |
| ITALY | 3 |
| JAPAN | 3 |
| CHINA | 4 |
Data Inputs with sourcing, Market Event, Product Event, Country specific Forecast Model, Market uptake and patient share uptake, Attribute Analysis, Analog Analysis, Disease burden, and pricing scenario, Summary, and Insights.
1. Postoperative Pain – Key Findings Summary |
| 1.1. Clinical findings |
| 1.1.1. Disease overview |
| 1.1.2. Therapeutic practices |
| 1.1.3. Future outlook |
| 1.2. Commercial findings |
| 1.2.1. Postoperative Pain market scenario 2023 |
| 1.2.2. Postoperative Pain market scenario 2028 |
| 1.2.3. Postoperative Pain market scenario 2033 |
2. Postoperative Pain Overview |
| 2.1. Disease Introduction |
| 2.2. Pathophysiology |
| 2.3. Signs and Symptoms |
| 2.4. Risk Factors |
| 2.5. Etiology |
| 2.6. Classification |
| 2.7. Pathogenesis |
| 2.8. Diagnosis |
| 2.9. Complications |
| 2.10. Treatment Algorithm |
| 2.10.1. Treatment in US (guidelines) |
| 2.10.2. Treatment in EU-5 (guidelines) |
| 2.10.3. Treatment in Japan (guidelines) |
| 2.10.4. Treatment in China (guidelines) |
| 2.11. Treatment Goals for Postoperative Pain |
| 2.12. Referral Patterns |
| 2.12.1. Referral Scenario in US |
| 2.12.2. Referral Scenario in EU-5 |
| 2.12.3. Referral Scenario in Japan |
| 2.12.4. Referral Scenario in China |
| 2.13. Postoperative Pain Prognosis |
| 2.14. Healthcare burden |
| 2.14.1. Healthcare burden in US |
| 2.14.2. Healthcare burden in EU-5 |
| 2.14.3. Healthcare burden in Japan |
| 2.14.4. Healthcare burden in China |
| 2.15. Unmet Needs in Postoperative Pain management |
| 2.16. Market Opportunity for Postoperative Pain |
| 2.17. KOL Comments on current and upcoming/expected treatment practices in Postoperative Pain |
3. Epidemiology |
| 3.1. Epidemiology Overview |
| 3.2. Epidemiology by Geography |
| 3.2.1. Postoperative Pain Epidemiology in US (2023-2033) |
| 3.2.1.1. Incidence of Postoperative Pain |
| 3.2.1.2. Diagnosed cases |
| 3.2.1.3. Treatable Patient Pool |
| 3.2.1.4. Epidemiology Trends |
| 3.2.2. Postoperative Pain Epidemiology in EU-5 (2023-2033) |
| 3.2.2.1. Incidence of Postoperative Pain |
| 3.2.2.2. Diagnosed cases |
| 3.2.2.3. Treatable Patient Pool |
| 3.2.2.4. Epidemiology Trends |
| 3.2.3. Postoperative Pain Epidemiology in Japan (2023-2033) |
| 3.2.3.1. Incidence of Postoperative Pain |
| 3.2.3.2. Diagnosed cases |
| 3.2.3.3. Treatable Patient Pool |
| 3.2.3.4. Epidemiology Trends |
| 3.2.4. Postoperative Pain Epidemiology in China (2023-2033) |
| 3.2.4.1. Incidence of Postoperative Pain |
| 3.2.4.2. Diagnosed cases |
| 3.2.4.3. Treatable Patient Pool |
| 3.2.4.4. Epidemiology Trends |
| 3.3. Epidemiology Trends (World-wide) |
4. Market Outlook |
| 4.1. US Postoperative Pain Market Forecast 2023-2033 |
| 4.1.1. Market Progression (Futuristic) |
| 4.1.2. Market Trends and Expectations |
| 4.1.2.1. Worst case scenario |
| 4.1.2.2. Base Case Scenario |
| 4.1.2.3. Best Case Scenario |
| 4.1.3. Drivers and Barriers |
| 4.2. UK Postoperative Pain Market Forecast 2023-2033 |
| 4.2.1. Market Progression (Futuristic) |
| 4.2.2. Market Trends and Expectations |
| 4.2.2.1. Worst case scenario |
| 4.2.2.2. Base Case Scenario |
| 4.2.2.3. Best Case Scenario |
| 4.2.3. Drivers and Barriers |
| 4.3. France Postoperative Pain Market Forecast 2023-2033 |
| 4.3.1. Market Progression (Futuristic) |
| 4.3.2. Market Trends and Expectations |
| 4.3.2.1. Worst case scenario |
| 4.3.2.2. Base Case Scenario |
| 4.3.2.3. Best Case Scenario |
| 4.3.3. Drivers and Barriers |
| 4.4. Germany Postoperative Pain Market Forecast 2023-2033 |
| 4.4.1. Market Progression (Futuristic) |
| 4.4.2. Market Trends and Expectations |
| 4.4.2.1. Worst case scenario |
| 4.4.2.2. Base Case Scenario |
| 4.4.2.3. Best Case Scenario |
| 4.4.3. Drivers and Barriers |
| 4.5. Italy Postoperative Pain Market Forecast 2023-2033 |
| 4.5.1. Market Progression (Futuristic) |
| 4.5.2. Market Trends and Expectations |
| 4.5.2.1. Worst case scenario |
| 4.5.2.2. Base Case Scenario |
| 4.5.2.3. Best Case Scenario |
| 4.5.3. Drivers and Barriers |
| 4.6. Spain Postoperative Pain Market Forecast 2023-2033 |
| 4.6.1. Market Progression (Futuristic) |
| 4.6.2. Market Trends and Expectations |
| 4.6.2.1. Worst case scenario |
| 4.6.2.2. Base Case Scenario |
| 4.6.2.3. Best Case Scenario |
| 4.6.3. Drivers and Barriers |
| 4.7. Japan Postoperative Pain Market Forecast 2023-2033 |
| 4.7.1. Market Progression (Futuristic) |
| 4.7.2. Market Trends and Expectations |
| 4.7.2.1. Worst case scenario |
| 4.7.2.2. Base Case Scenario |
| 4.7.2.3. Best Case Scenario |
| 4.7.3. Drivers and Barriers |
| 4.8. China Postoperative Pain Market Forecast 2023-2033 |
| 4.8.1. Market Progression (Futuristic) |
| 4.8.2. Market Trends and Expectations |
| 4.8.2.1. Worst case scenario |
| 4.8.2.2. Base Case Scenario |
| 4.8.2.3. Best Case Scenario |
| 4.8.3. Drivers and Barriers |
| 4.9. Key Expected Milestones (world-wide) Impacting the Market |
5. Competitive Landscape |
| 5.1. Pipeline Therapies Overview |
| 5.1.1. Phase III Therapies |
| 5.1.1.1. Current Status |
| 5.1.1.2. Trial details, results |
| 5.1.1.3. Approval Timeline |
| 5.1.1.4. Likelihood of approval |
| 5.1.1.5. Expected Product Positioning |
| 5.1.1.2. All other Phase III Therapies ….. |
| 5.1.1.3. Attribute Analysis of Phase III molecules |
| 5.1.2. Phase II and Phase I/II Therapies |
| 5.1.2.1. Current Status |
| 5.1.2.2. Trial details, results |
| 5.1.2.3. Approval Timelines |
| 5.1.3. List of active Pre-clinical Therapies |
| 5.1.3.1. Status in Postoperative Pain |
| 5.1.3.2. Company positioning |
| 5.1.3.2. All other pre-clinical therapies |
| 5.1.4. List of Inactive/discontinued assets |
| 5.1.4.1. Business impact of discontinuations on current pipeline |
| 5.1.5. Potential winners from Postoperative Pain Pipeline |
| 5.1.5.1. Potential Blockbusters across the pipeline |
6. Regulatory/Approval Scenario |
| 6.1. Regulatory/Approval Framework in US |
| 6.1.1. Policy Framework |
| 6.1.2. Payer Expectations |
| 6.2. Regulatory/Approval Framework in UK |
| 6.2.1. Policy Framework |
| 6.2.2. Payer Expectations |
| 6.3. Regulatory/Approval Framework in France |
| 6.3.1. Policy Framework |
| 6.3.2. Payer Expectations |
| 6.4. Regulatory/Approval Framework in Germany |
| 6.4.1. Policy Framework |
| 6.4.2. Payer Expectations |
| 6.5. Regulatory/Approval Framework in Italy |
| 6.5.1. Policy Framework |
| 6.5.2. Payer Expectations |
| 6.6. Regulatory/Approval Framework in Spain |
| 6.6.1. Policy Framework |
| 6.6.2. Payer Expectations |
| 6.7. Regulatory/Approval Framework in Japan |
| 6.7.1. Policy Framework |
| 6.7.2. Payer Expectations |
| 6.8. Regulatory/Approval Framework in China |
| 6.8.1. Policy Framework |
| 6.8.2. Payer Expectations |
7. Clinical Trial Assessment – Current and Future Paradigm |
| 7.1. Distribution of Primary Endpoints across trials |
| 7.2. Distribution of Secondary Endpoints across trials |
| 7.3. Evolution and acceptance of surrogate endpoints |
| 7.4. Key Investigator initiated trials |
| 7.5. Attrition analysis |
| 7.5.1. Suspended/Discontinued Assets |
| 7.5.2. Failed Trials, Reasons and Business Impact |
| 7.5.3. Terminated Trials, Reasons and Business Impact |
| 7.5.4. Withdrawn Trials, Reasons and Business Impact |
| 7.6. Trial enrollment scenario and challenges |
| 7.7. Clinical Trial Guidance (across geographies) |
8. Thelansis Commentary |
| 8.1. Key Unmet needs in Postoperative Pain |
| 8.2. Possible Best-case Clinical Trial Strategies |
| 8.3. Possible Best Case Targeted Product Profile (TPP) |
| 8.4. Possible Best-case Market positioning strategies |
| 8.5. Possible Best-case Market Access Strategies |
| 8.6. Possible Best-case LCM Strategies |
| 8.7. Overall View on Postoperative Pain Market in Dollar Value |
9. Report Methodology |
| 9.1. Secondary research |
| 9.2. Primary research |
| 9.3. Data collation |
| 9.4. Insight Generation |
10. About Thelansis |
| 10.1. Our Capabilities |
| 10.2. Our Services |
| 10.3. Our Contacts |
| 10.4. Disclaimer |

Head – Business Development and Partnering
Mr. Pankaj Negi has joined Thelansis as Practice Head; Business Development and Partnering, since Jan 2020. A dynamic professional with 12+ years of diverse experience across Pharmaceuticals/ Healthcare/ Life sciences with specialized in sales & marketing and Business Development.
Mr. Pankaj is holding a Master’s degree in “Pharma Management” from the Rajiv Gandhi University of Health Science, Bangalore, India and has expertise in Content Marketing, Content Management systems, Customer Relationship Management, online marketing, advertising, promotion, and Search Engine Optimization. Creating and implementing client-centered, successful campaigns, aimed at improving brand awareness and presence.

Vice President – Delivery, Scientific CI
Mukesh Kumar has joined us as Vice President – Delivery & Innovations, Scientific CI Practice, since August 2019. Prior to joining us, Dr. Mukesh holding a Postdoctoral Fellow with a demonstrated history of working in hard-core research for more than 15 years on both small molecule and biologics within the oncology and neurology segment.
Skilled in Recombinant DNA, Phage Display Technology, Antibodies, ImmunoOncology (K-RAS, Check-Point, Oncolytic), and Immunotherapeutic (RNA andProtein/huMab-based) products, Cancer-stem Cells, Chemoresistance, Real-TimePolymerase Chain Reaction (qPCR), and SDS-PAGE. Strong research professional with a Ph.D. focused on Recombinant Antibody-mediated tumor targeting. Dr.Mukesh has several citations on Synergistic increase in efficacy of a combination of 2-deoxy-D-glucose and cisplatin in normoxia and hypoxia: switch from autophagy to apoptosis, Membrane, Fusion Mediated Targeted Cytosolic DrugDelivery Through scFv Engineered Sendai Viral Envelopes, and Drug combination targeting hypoxia-induced chemoresistance and stemness in glioma cells.

Director – Practice Head, Competitive Intelligence, Market Access, and Pricing
Mr. Peeyush Potdar is working at Thelansis as Practice Head; Competitive Intelligence, Market Access, and Pricing Analytics, since Dec 2017. With 12+ years of rich experience in providing business consulting and research support across competitive intelligence, BD&L activities, KOL management, business research, and analytics services, he has been involved in the development of syndicated therapy area specialized reports in Orphan & ultra-orphan indications and conducting market intelligence assignments on different verticals such as Pharmaceuticals, Medical Devices and Health Insurance.
Mr. Peeyush is holding an MBA degree in “Pharma Management” from the National Institute of Pharmaceutical Education & Research (NIPER), Mohali, India and has expertise in scientific research as well as in commercialization and lifecycle management for innovative and mature assets. He has a good competency in building AI/ ML-based analytics platforms for tracking global conferences, social media analytics, and for conducting patient outcomes research.

Director – Global Relationship and Partnering US
Ms. Martina is working with us as Director – Global Relationship and Partnering US, since October 2019. Prior to joining us, Ms. Martina holding a Master’s Degree in Public Health from Boston University School of Public Health with more than 8 years of experience in B2B and B2C sales. Highly motivated and accomplished sales and marketing professional with a proven history of success in creating the road map and driving business development globally.
Part of US Leadership team and heading Business Development for Thelansis Knowledge Partner for both US and EU Region. Business Development opportunity identification, Engaging with the client and providing them with innovative business solutions.

Director – Global Relationship and Partnering EU